Bojack-Tidytext-Analysis
Term Importance
Term Frequency - Inverse Document Frequency
To quote Silge & Robinson:
Calculating tf-idf attempts to find the words that are important (i.e., common) in a text, but not too common.
TF-IDF considers the terms that are most frequent in a corpus, and the term frequency within specific items of the corpus. A term that is common in some, but not all, elements of a corpus may indicate that it is more significant
tf_idf_dfTOTAL <- tidy_bojack %>% mutate(EpID = as.factor(paste0(season_num, "x", episode_num))) %>%
count(season, word, sort = TRUE) %>%
bind_tf_idf(word, season, n)
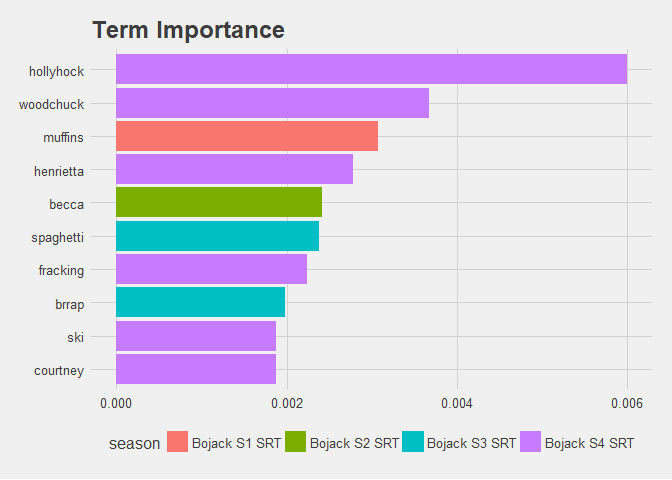
tf_idf_dfTOTAL %>% mutate(word = reorder(word, tf_idf)) %>% top_n(10) %>% ggplot(aes(x=word, y=tf_idf, fill = season)) + geom_col() + coord_flip() + ggtitle("Term Importance") + ylab("TFIDF")
tf_idf_dfSEASONS <- tidy_bojack %>%  group_by(season) %>% count(season, word, sort = TRUE) %>% bind_tf_idf(word, season, n) %>%  mutate(word = reorder(word, tf_idf)) %>% top_n(10)

tf_idf_dfSEASONS %>% ggplot(aes(x=reorder(word,n), y=tf_idf)) + geom_col(fill = "steelblue") + coord_flip() + facet_wrap(~ season, scales = "free_y") + ggtitle("Term Importance by Season")
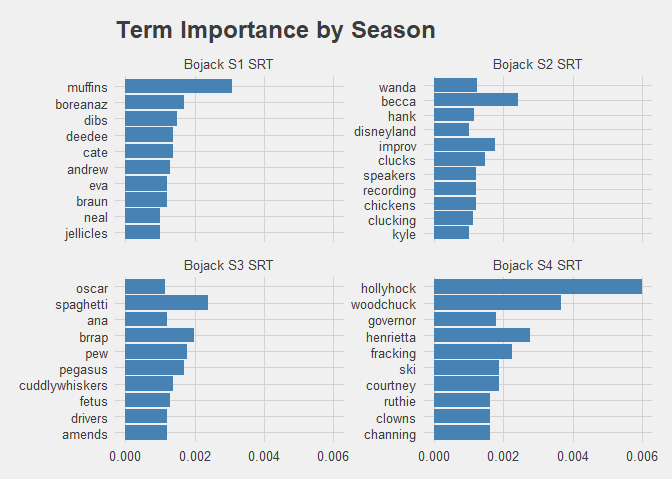
This is an excellent example of how TF-IDF can identify terms that are important due to their frequency, without being overpowering. In season 1, muffins are a key topic of one episode; in another, a biopic of Eva Braun is a focal point of the B-Plot. Similarly, chickens raise uncomfortable ethical implications in Season 2, and Mister Cuddlywhiskers is a plot driver in Season 3. Most tellingly, Hollyhock is an important character throughout Season 4, appearing in the majority of episodes, however her name is marked with high significance, as is Henrietta.
Thus, by examining the TF-IDF of the show, we drop all the main characters for being too frequent in appearance. But we perfectly identified the primary focus of Season 4.
Since first drafting this, I have noticed that I may have misapplied the TF-IDF function. The layout should be:
tbl | A tidy text dataset with one-row-per-term-per-document term | Column containing terms as string or symbol document | Column containing document IDs as string or symbol n | Column containing document-term counts as string or symbol
However, I have used the dataset for one row - per term - per season. Not per episode/document. This could be correctly applied for the first chart, depending on how we wish to examine term significance, e.g. looking for seasonal elements. But this is incorrectly applied for the second focus on importance within the season. This bears further examination and correction.